


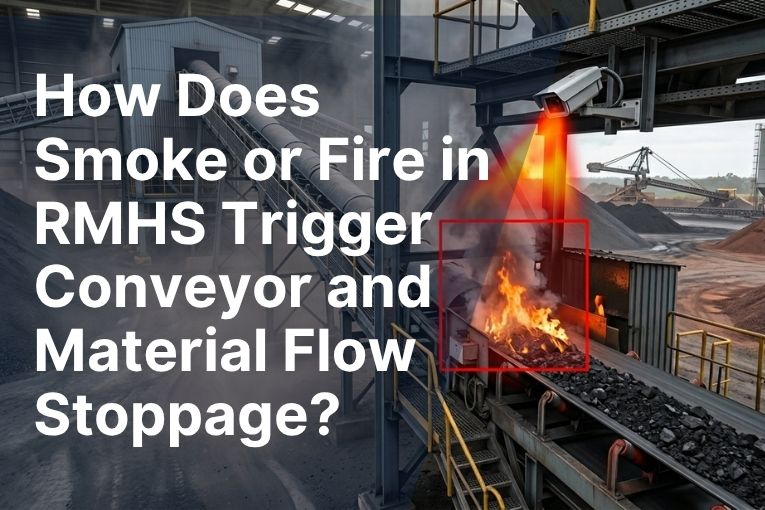
Fire and smoke incidents in the Raw Material Handling System (RMHS) represent a significant operational...
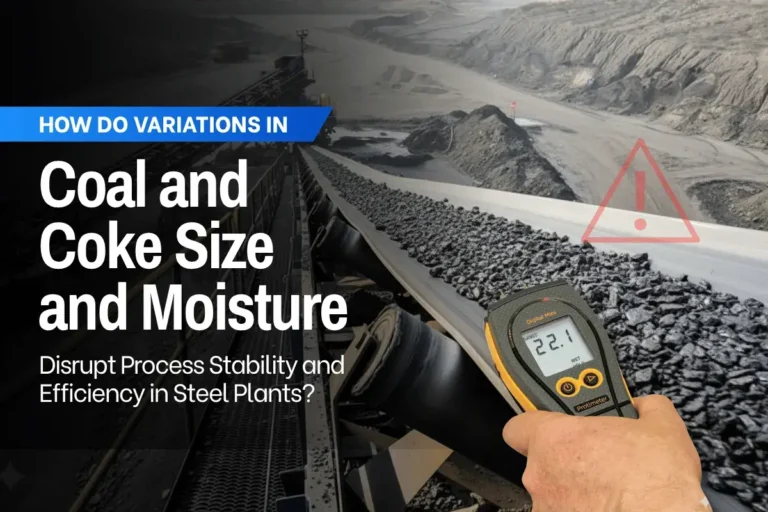
In modern steel plants, operational stability depends not only on equipment performance and automation...

Hotspot Monitoring of Electrical Equipments has emerged as the most effective technique to detect overheating,...

Discover how AI and vision analytics reduce process variability in manufacturing — cutting energy costs...
Fire and smoke incidents in the Raw Material Handling System (RMHS) represent a significant operational...
In modern steel plants, operational stability depends not only on equipment performance and automation...
Hotspot Monitoring of Electrical Equipments has emerged as the most effective technique to detect overheating,...
Discover how AI and vision analytics reduce process variability in manufacturing — cutting energy costs...